What can machine learning do for human learning? In a joint project, the Digital Pedagogical Methodology Centre, Microsoft and Dmlab set out to answer how data analysis can support the fight against early school leaving. The answer came together on three levels: what happened, why it happened, and what will happen.
Project data at a glance
| |
|---|
| Area | Public education, early school leaving |
| Partners | DPMK (domain knowledge), Microsoft (technology), Dmlab (data analysis) |
| Data sources | Institutional and teacher data, national competence assessment, PISA, Kréta system |
| Technology | Azure, Power BI |
| Solution levels | Descriptive analysis and dashboard, association discovery, prediction |
| Highlighted result | 92 percent accurate prediction for institutions with hidden risk |
Why is early school leaving a problem?
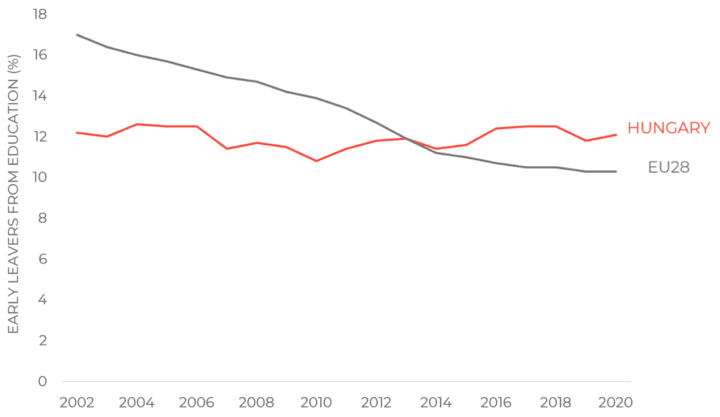
An early school leaver is a young person between 18 and 24 who has at most an elementary-school education. In Hungary, this rate is roughly 12 percent, which means about 80,000 young people every year.
It is worth putting that number next to another one: around 50,000 Hungarian young people earn a university degree every year, while 80,000 are left without a secondary-school qualification. The Europe 2020 strategy targets 10 percent, and while at European level there was an overall drop of 7 percentage points between 2002 and 2019, in Hungary the indicator has essentially stagnated.
So the problem is measurable, large-scale, and has a decades-long effect on the lives of those affected. Exactly the kind of question where data is interesting not in itself, but because it helps find where and when to intervene.
Three levels, three questions
In the project, we did not build a single solution, but three reference solutions layered on top of one another. This division matches the way the four types of data science projects build on each other: first you need to see what is happening, then understand why, and only then does it make sense to predict.
| Level | The question | The solution | What it can be used for |
|---|
| Descriptive | What happened? | Integrated dataset and dashboard | Comparing institutions, spotting outliers |
| Diagnostic | Why did it happen? | Automatic association discovery | Identifying institutional characteristics that carry risk |
| Predictive | What will happen? | Prediction model | Filtering out institutions with hidden risk before intervention |
What happened? A unified dataset and dashboard
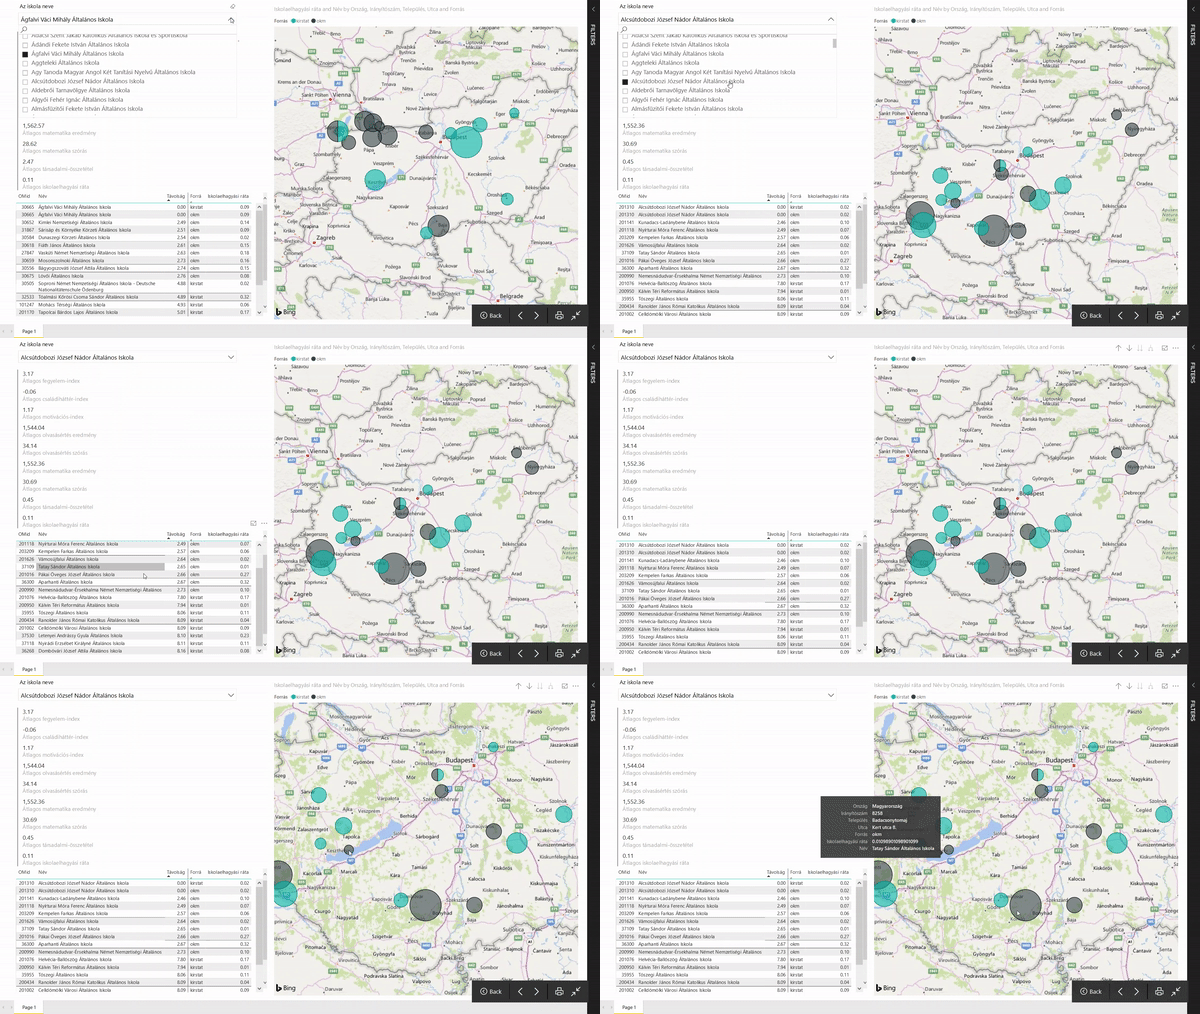
The first level, by itself, already gives surprisingly a lot, even though technologically it is the simplest. Educational data is created in several places, in several systems: at institutional, teacher and student level alike. The point of the unified dataset and dashboard is that these can be examined from a single viewpoint, so that one shared source of truth is created on which professional debate can build.
The most important observation at this level was that significant differences appear in dropout rates between similar institutions, and these differences cannot be explained by geographical proximity. This insight alone already gives direction: if two similar schools perform very differently, then there is something to learn from one of them.
Why did it happen? Uncovering hidden associations
At the second level, we used automatic feature discovery to look for institutional subgroups within which different associations hold than in the full sample. The method selects from more than ten thousand possible features those that really distinguish a group, so it does not test pre-existing hypotheses but finds the pattern itself.
One of the most telling results came out for a group of institutions with mixed ethnic composition and a high share of repeaters. In this group, in schools without a school secretary, the dropout rate was 57 percent; where there was one, it was 36 percent.
The difference is large, and that is precisely why it must be handled with care. Association does not mean causation: it is not the hiring of a school secretary that reduces dropout, but rather the presence of a school secretary may be a sign of organisational and administrative capacity that has another effect. Such a result is not a measure, but a clue: it shows where the expert should look further. This is the point where data analysis and domain expertise become inseparable.
What will happen? Prediction
At the third level, we examined how predictably dropout can be forecast. Two results emerged.
One is that the institutional averages and standard deviations of the national competence assessment can be predicted from earlier competence assessment and school statistical data.
The other, and from a practical point of view the more interesting one, concerns those institutions where high dropout would not be expected based on the competence assessment, yet it still happens. These are the schools with hidden risk, which slip through a traditional screening. With additional institutional features included, these cases can be predicted with 92 percent accuracy.
This is the point where analysis turns into decision support: instead of a general risk ranking, you get a list of institutions that no one would have paid attention to on their own.
What can this do at scale? An international example
A good example of what a similar approach can achieve at scale is Microsoft’s predictive solution implemented in the Tacoma district. There, before the programme was introduced, 55 percent of students completed secondary school successfully; after it, 83 percent.
That is not the model’s merit on its own. The number shows what happens when prediction becomes part of everyday operations, that is, when there is someone who actually acts on the signal.
What data can this be built on in Hungary?
One side result of the project was a mapping of Hungarian data assets. Four source groups proved usable:
- Institutional data: buildings, infrastructure, operational characteristics.
- Teacher data: qualifications, completed training, workload.
- Student competencies: the results of the national competence assessment and the PISA test.
- Kréta system: data on students’ everyday school behaviour.
The greatest value lies in the fact that these can be viewed together. Separately, each one is known; only connected do they answer the question.
Who did what?
The project was built on the cooperation of three players, and each brought something different. DPMK brought domain knowledge, Microsoft brought technology, the capabilities of Azure and Power BI, and Dmlab brought data analysis expertise.
Ádám Horváth, head of the DPMK division, summed it up like this: "During the joint project, professional findings emerged that would have had no chance of coming up with traditional data analysis tools."
This division is no accident. A public-sector data project delivers results when the professional question is understood by the person working in the field, and the data is analysed by someone who knows how, and the two are present not one after the other but at the same time.
What does this mean for another organisation?
Three lessons can be transferred to almost any field.
- It is worth looking for value at multiple levels. Even in a well-defined problem, descriptive analysis, association discovery and prediction each provide something different. If you jump straight to prediction, you often skip the insight that would have delivered the most for the least cost.
- The result can only be interpreted together with the expert. The data analyst finds the pattern, but what it means and what can be done with it can only be decided together with the field expert.
- Association is not causation. This is not just a theoretical warning. In a public-sector decision, a misread correlation can become a real intervention, so the model must be not only accurate but also interpretable.
The same logic works in other industries too, as our case studies show. The more a process becomes data-driven, the greater its business and social impact.
Frequently asked questions
Who counts as an early school leaver?
A young person between 18 and 24 who has at most an elementary-school education. In Hungary, this rate is roughly 12 percent, which means about 80,000 young people every year.
How accurately can dropout be predicted?
In the project, for those institutions where high dropout would not be expected based on the competence assessment, yet it still happens, we achieved 92 percent accurate prediction by including additional institutional features.
Does the prediction rank students or institutions?
In this project, we worked at institutional level. This has both data-protection and professional reasons: at institutional level, intervention is also organisational, and no individual-level risk label is created.
Does this require new data collection?
Not necessarily. The project built on existing sources: institutional and teacher data, competence assessment, PISA results and the Kréta system. A large part of the work was not obtaining the data, but connecting and interpreting it.
Can this be transferred to another public-sector field?
Yes, the structure can. Layering descriptive, diagnostic and predictive levels, interpreting them together with a domain expert, and handling causality cautiously are just as relevant in healthcare, social services or employment policy.