
Portfolio Management in Energy Trading
A complex data collection, portfolio management and trading system in the energy sector

At media agency MMS Communication, monthly Excel reports built by hand were replaced by a single, continuously refreshed dashboard system. Agency staff and their clients now analyze campaign performance themselves, without technical skills.
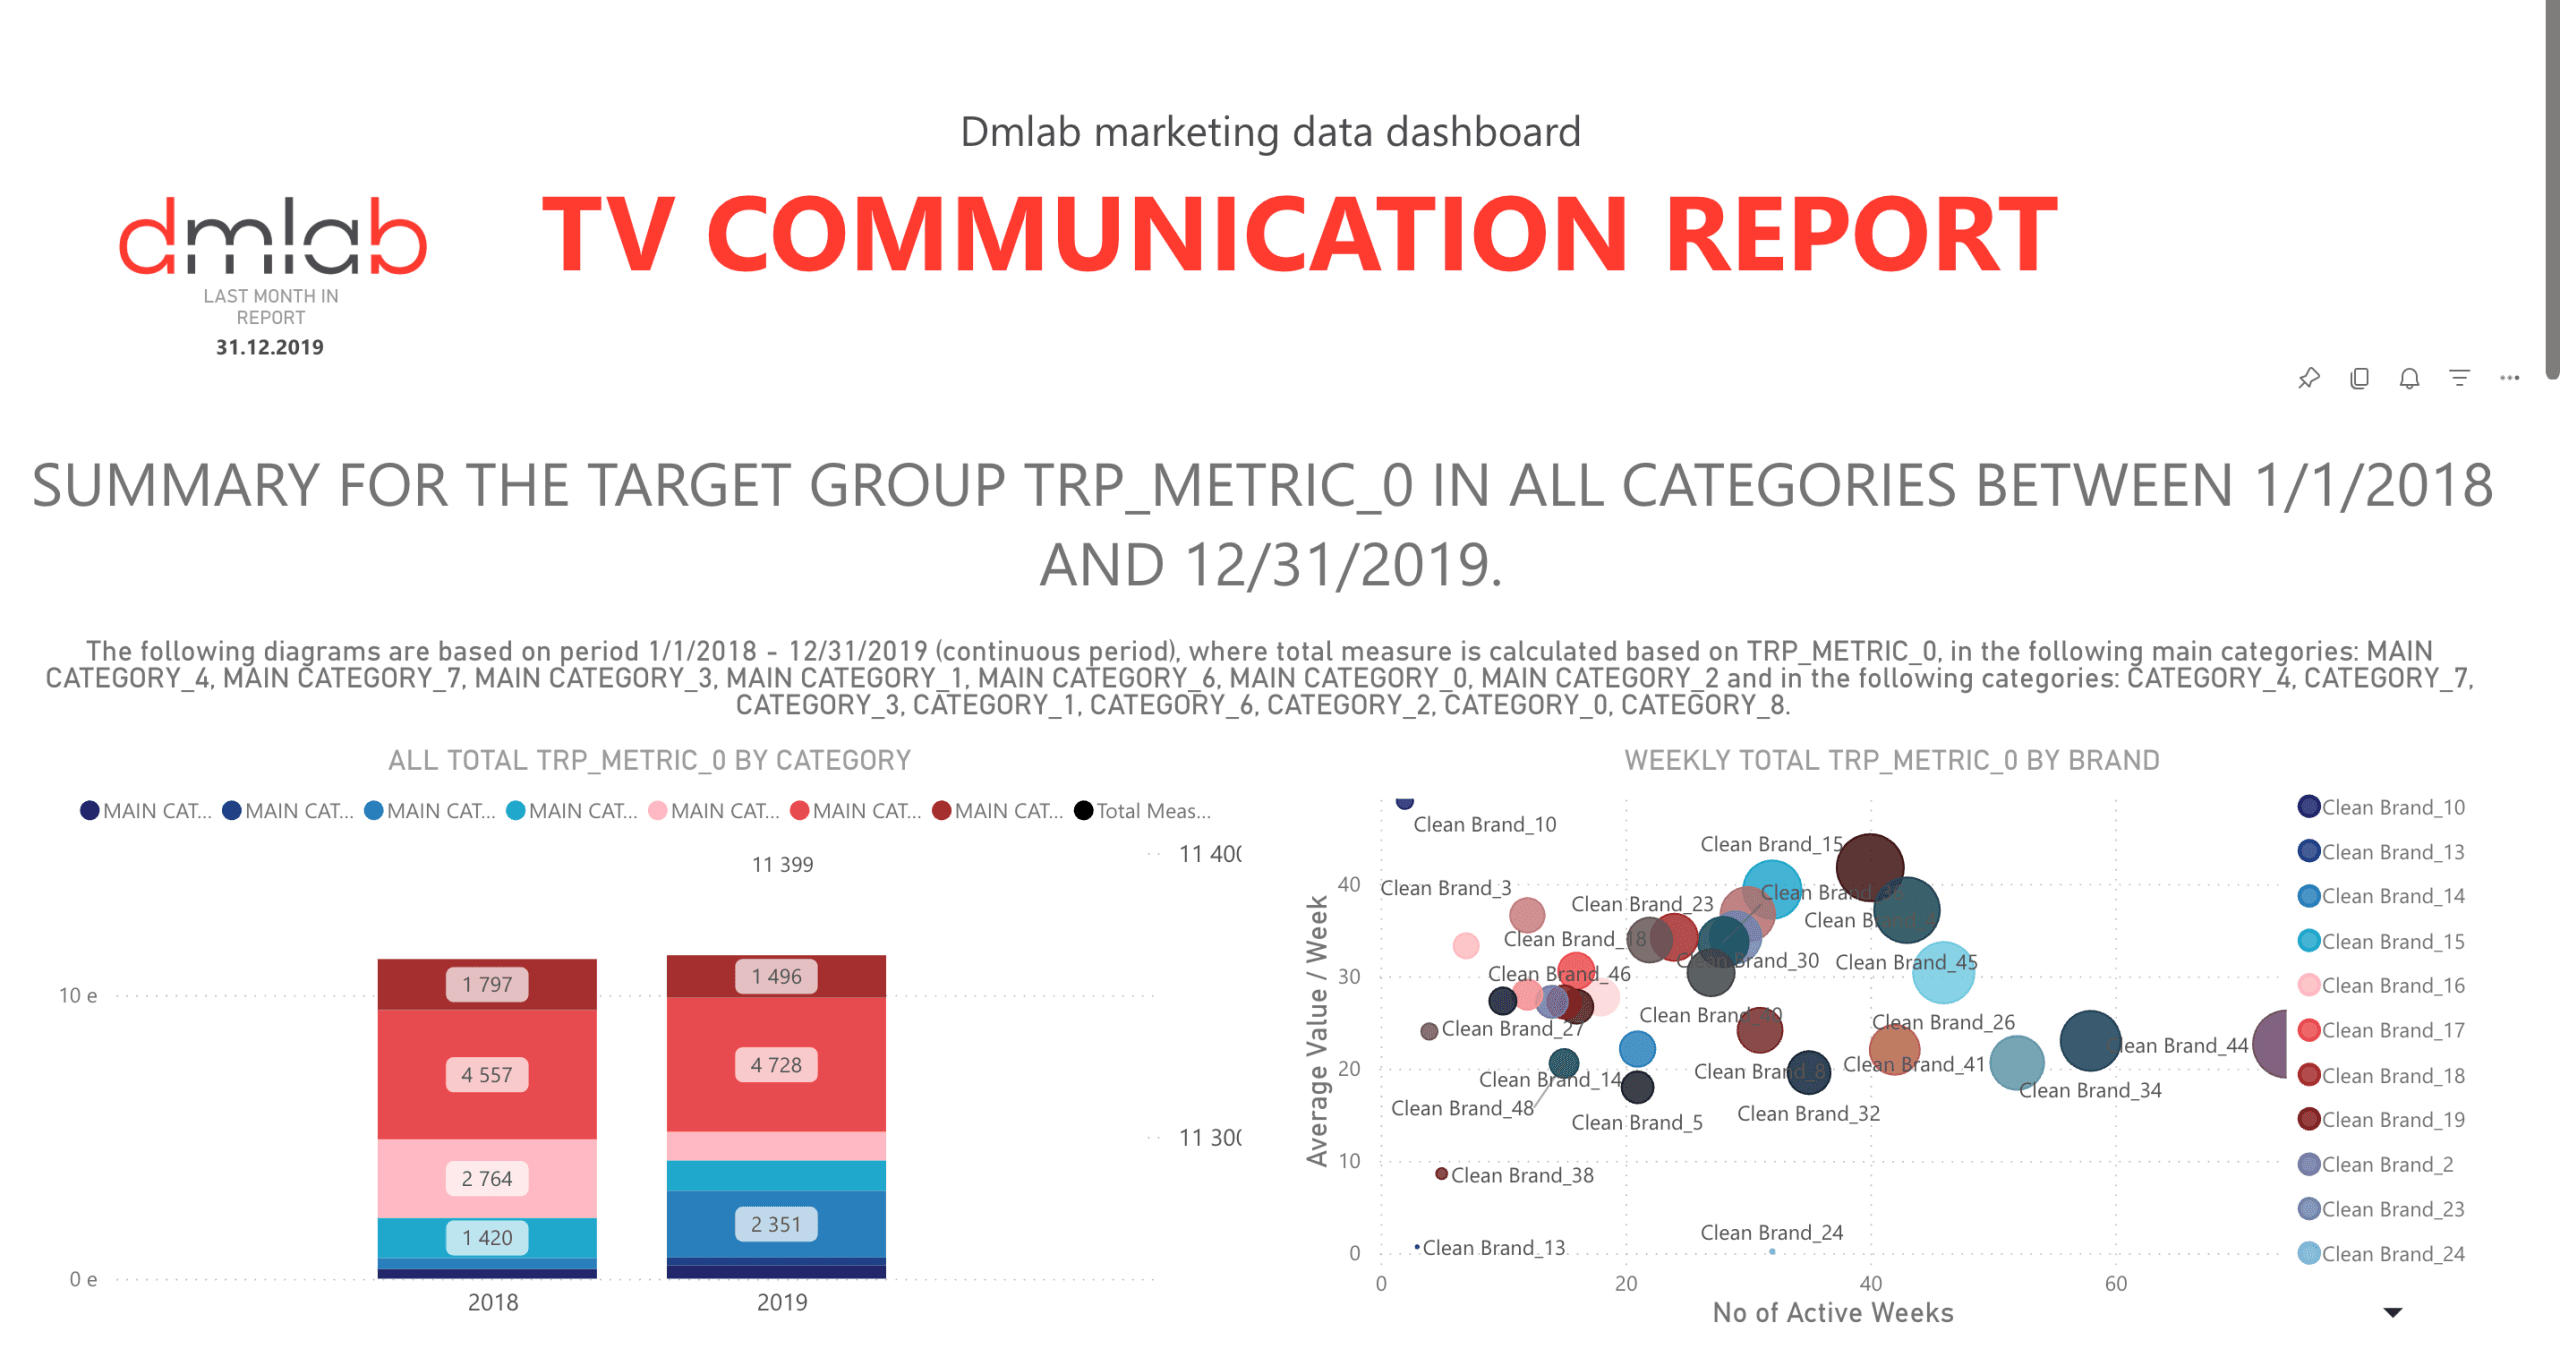
Every month the agency reported to its clients on media spend and on the performance of television, radio and online campaigns, in tailored Excel files and presentations. Most of the working time of campaign managers went into collecting, organizing and connecting data from different systems. Clients, meanwhile, received statistics only once a month, so they could evaluate campaign performance only in hindsight. The brief was to make reporting automatic and to make the data analyzable by anyone.
The task was solved by combining technology and agile consulting. First we clarified together what is worth measuring, and only then did we build the system. Instead of speeding up the old reports, we redesigned the whole measurement process.
We defined the relevant business metrics together with the agency experts, then built a single dashboard design for every marketing channel, based on what the previously client specific reports had in common.
Data arrives from online systems through APIs and from offline sources through structured uploads. Cleaning and standardization run automatically, and storage sits in the cloud, designed so that operation can be handed over to the agency.
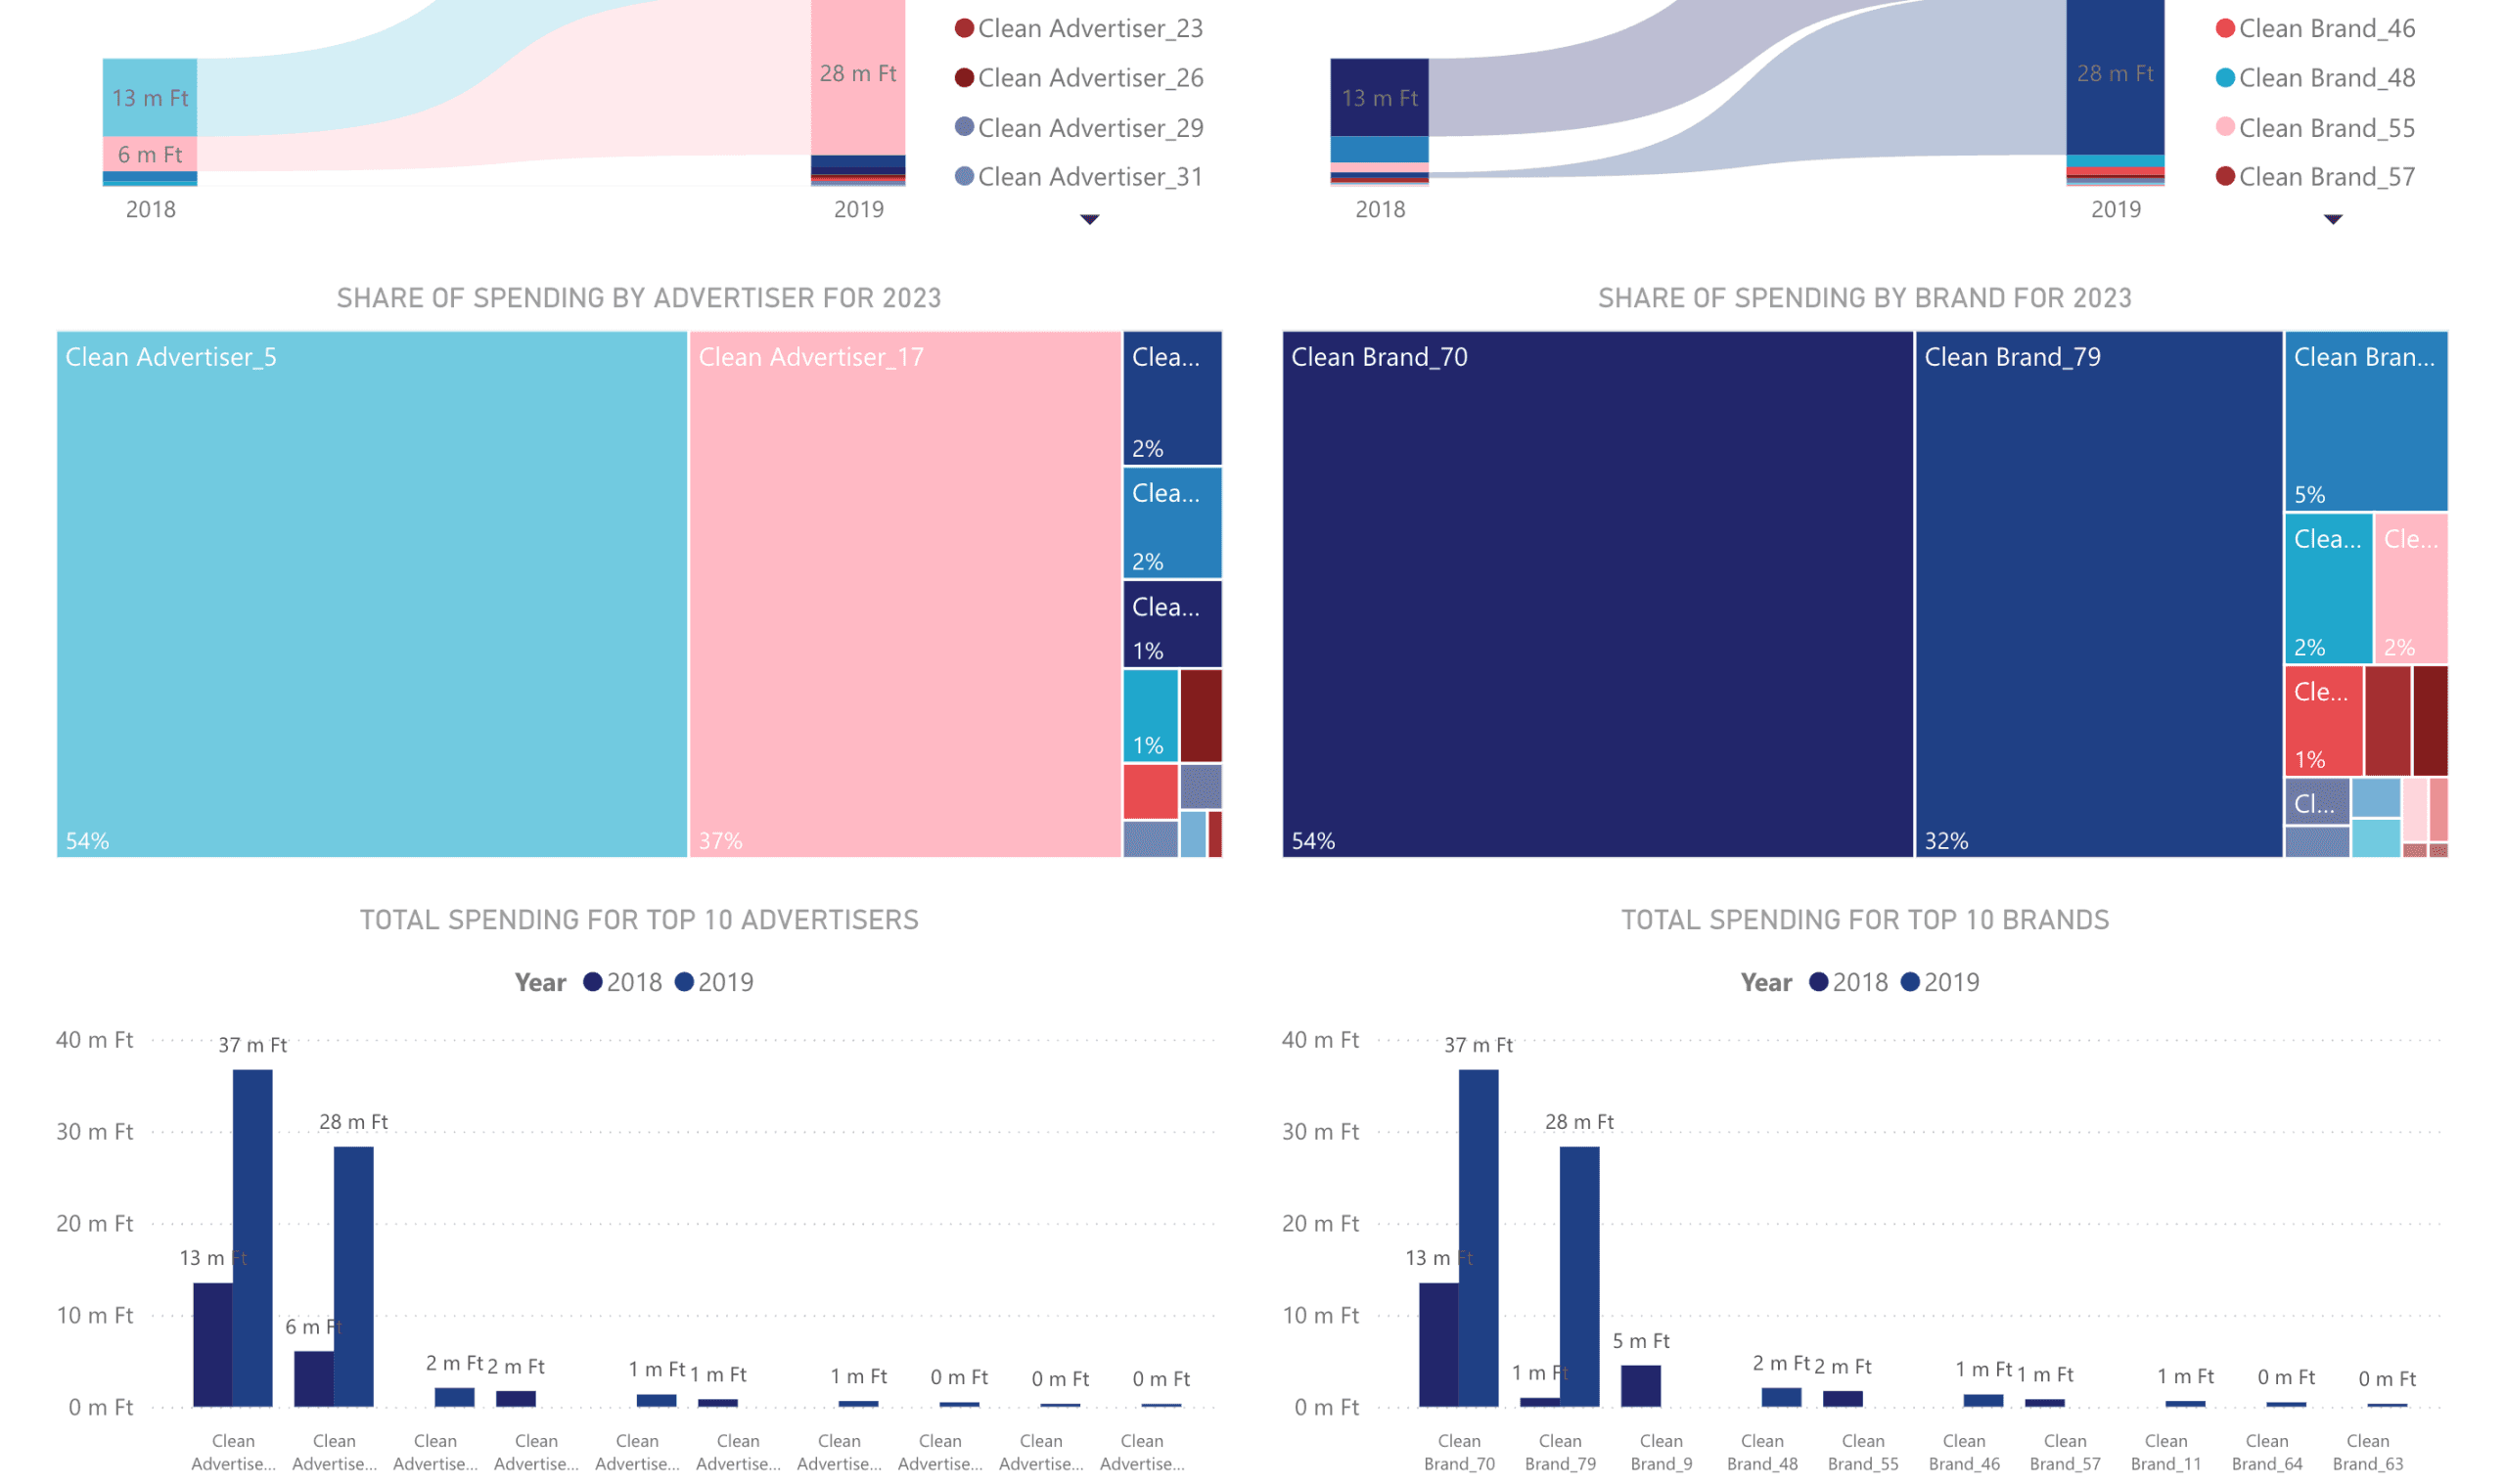
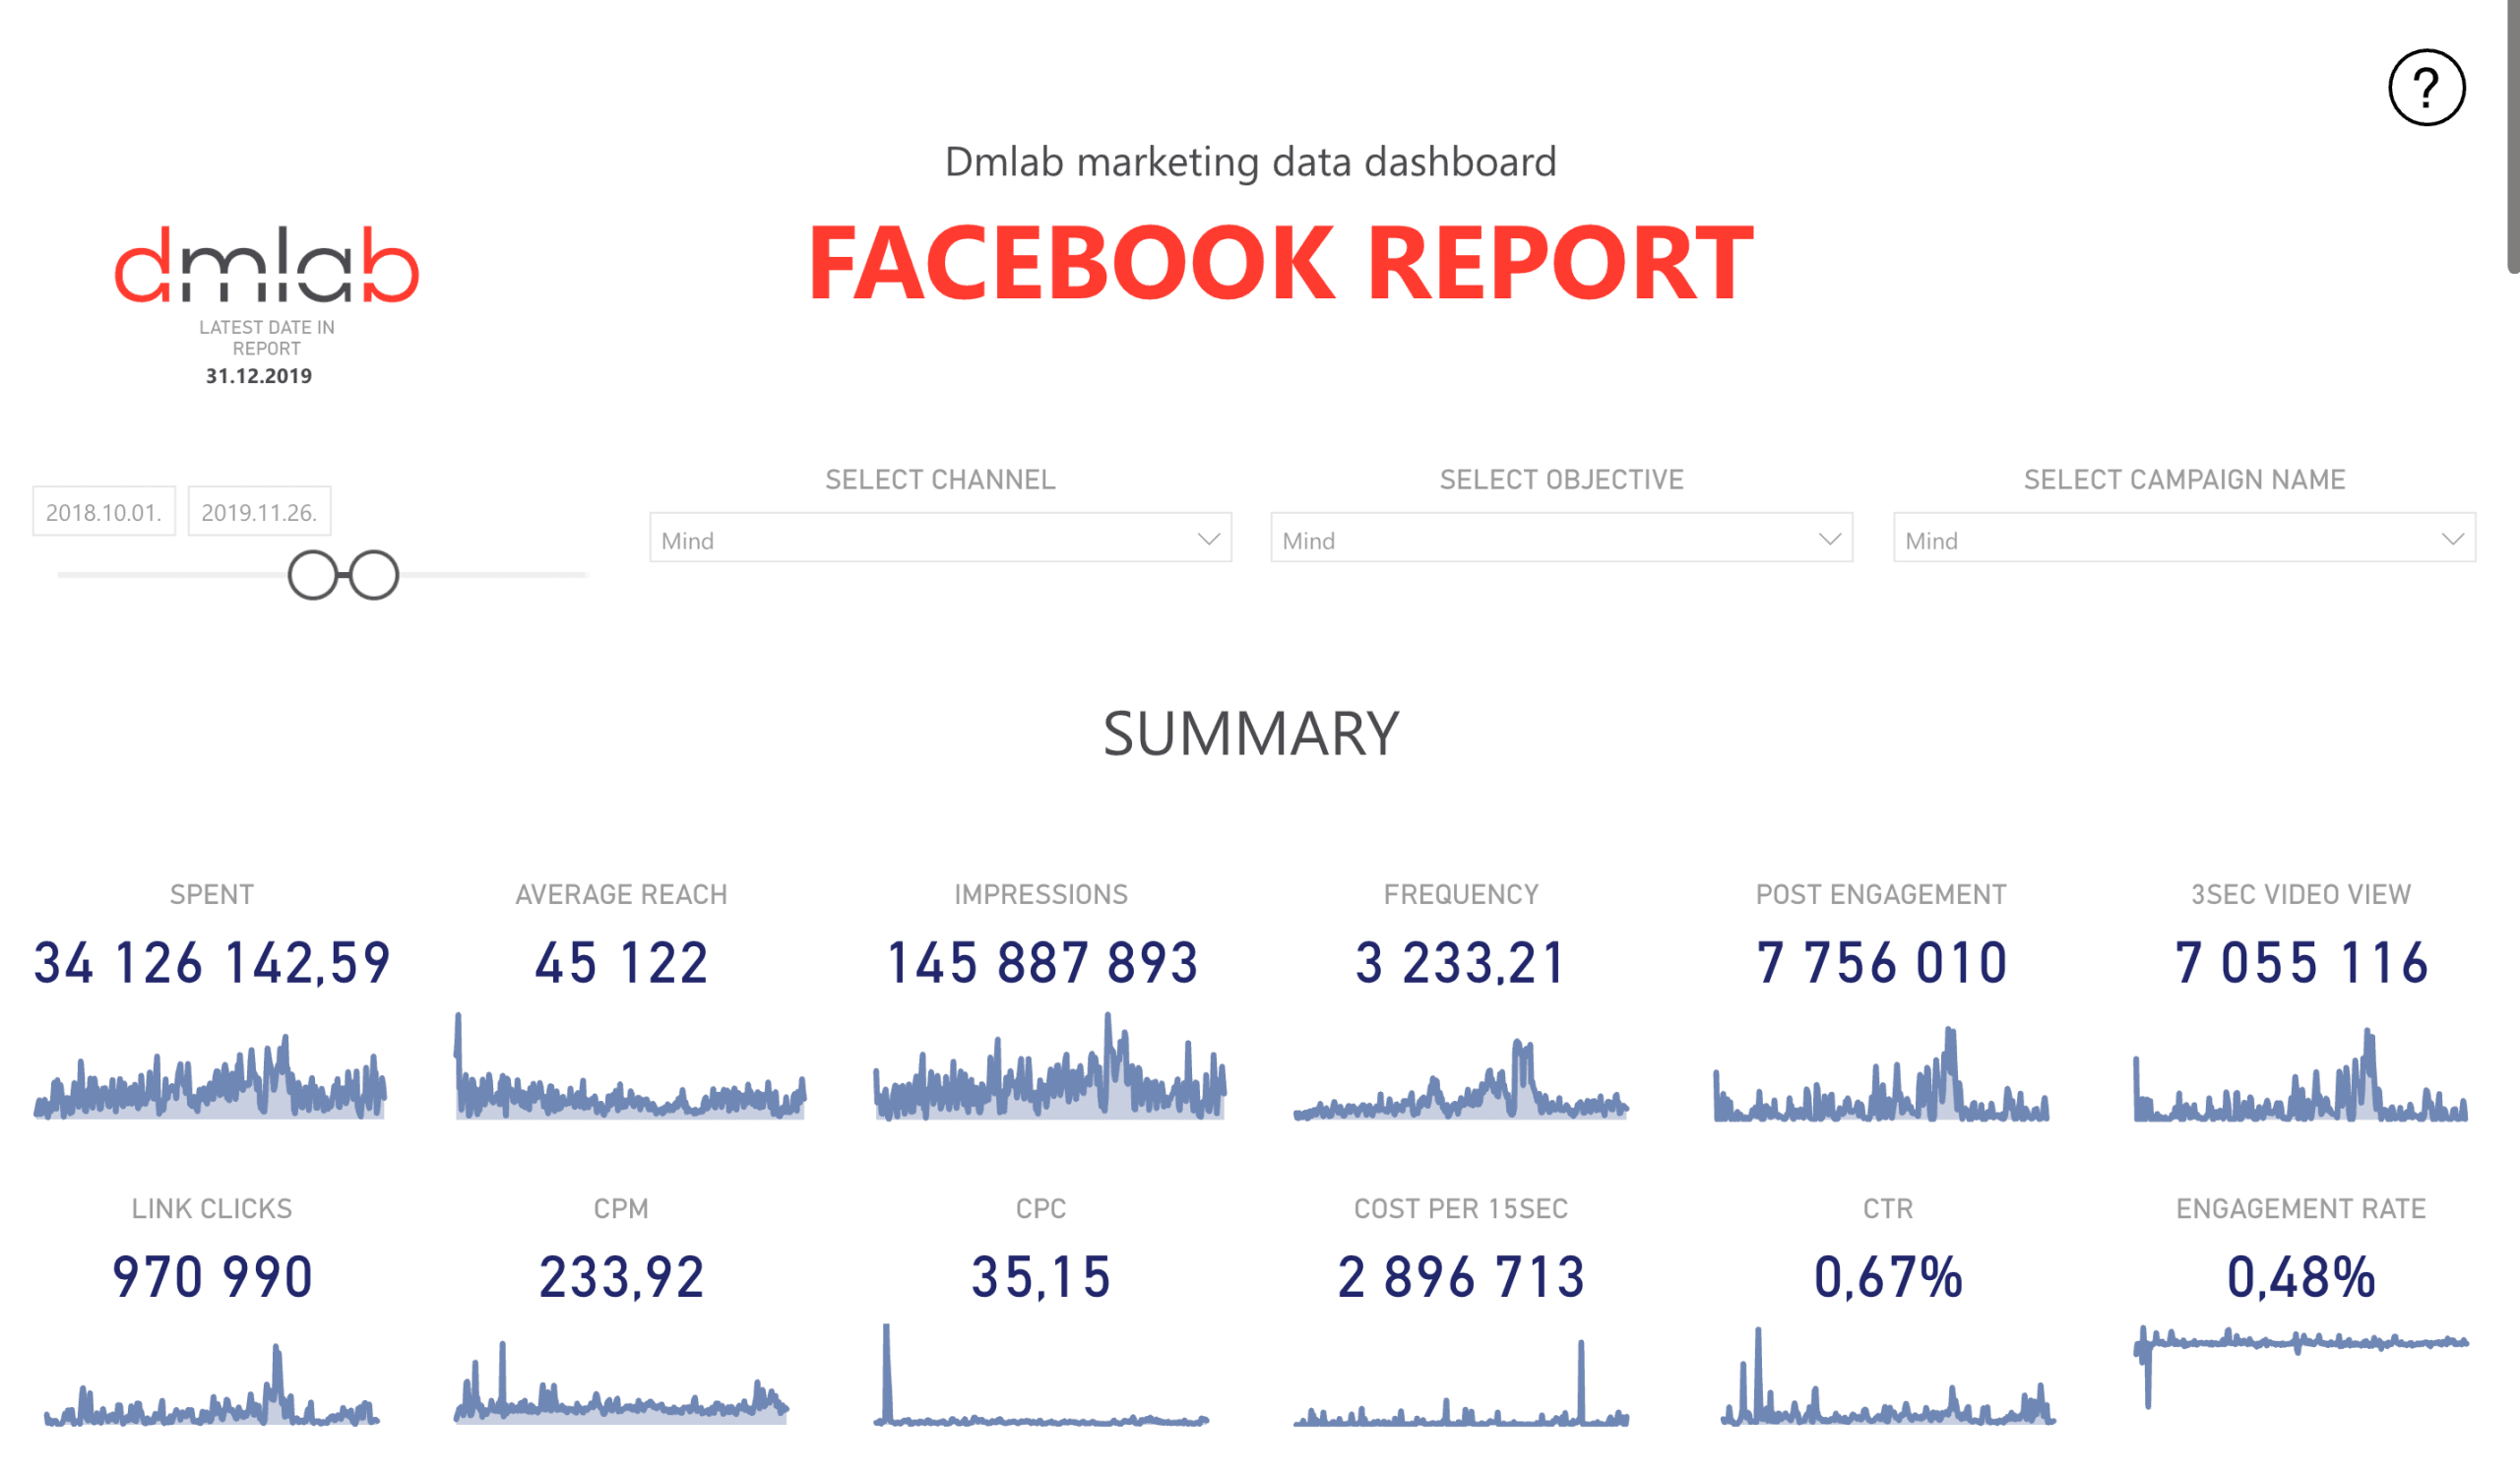
We delivered 11 interactive dashboards and an admin interface where the agency can set up a dashboard for a new client in minutes, with no technical skills. Data and reports of individual clients remain strictly separated.

The first step was not development but joint thinking: together with the agency team we defined the data and business metrics the dashboard system had to show.
We then reviewed earlier reports with the owner of each channel and, based on what they had in common, created a single design, a wireframe, for every marketing channel. Reports that used to differ in format from client to client became one comparable system. We start every data science project this way; it is the business understanding phase of the CRISP-DM method.
Part of the task was technological, part of it came from how an agency works. Reports that used to differ in format and content from client to client had to be unified. Data had to arrive from online and offline systems alike.
For data protection reasons, access to the data and dashboards of individual clients had to be strictly separated. The data warehouse had to be built so that its operation could later be handed over to the client. Data upload and dashboard creation had to scale to any number of new clients and had to be operable by agency staff themselves. All of this with as little extra work as possible, because a new system survives only if it does not overload the team.


The wireframes defined which data was needed from which system. Part of it arrives online through APIs, part through manual uploads in spreadsheet or text format.
Automated functions prepare, standardize and clean the data, and storage runs on cloud infrastructure. The entire system, including the data warehouse, was designed so that its operation can later be handed over to the client.
The dashboards were built in Power BI. The tool does not produce static pictures of the past but live, interactive surfaces where anyone can explore the data from any angle.
Access levels assigned to users also satisfy the data protection requirement: every client sees only its own data.


We added an online data management interface where agency staff can create any number of dashboards for any client on the existing databases. A user manual supports the interface, so the solution extends to new clients easily, without further development.
The project delivered more than the original brief. Interactive dashboards allow deeper analysis from any angle. Results from different systems appear in the same structure on one surface, so campaigns running on different channels finally became comparable and their data can be combined.

The project delivered a marketing BI tool: a component for automated data storage, a system of 11 dashboards and an admin interface for data management. Clients access up to date reports, so they follow and adjust campaign performance while campaigns are still running. Manual reporting was replaced by one automated solution, which brought tangible savings in time and cost and can be extended to the entire client base and to new clients.
A dashboard on its own is just a nice chart. The change came from making the whole reporting process data driven: collecting and cleaning the data, managing access rights and onboarding a new client all happen automatically or in self service. The more elements of a process become data driven, the bigger the business impact, and the more time the team has for what it is paid to do: analysis and decisions.
A complex data collection, portfolio management and trading system in the energy sector

Data driven fuel and transit time planning in road freight