
XAI, or Explainable Artificial Intelligence
Explainable AI is not a model type, but a toolkit for finding out what a model is based on. An overview of ante-hoc and post-hoc methods, LIME and SHAP, and what regulations expect from explanations.
15 July 2019 - reading time: 23 min

The six phases of CRISP-DM are not theory, but the sequence in which a data project stays on track. We walk through a bank credit card campaign, show where the time goes, and what has changed in the deployment phase in the age of MLOps.

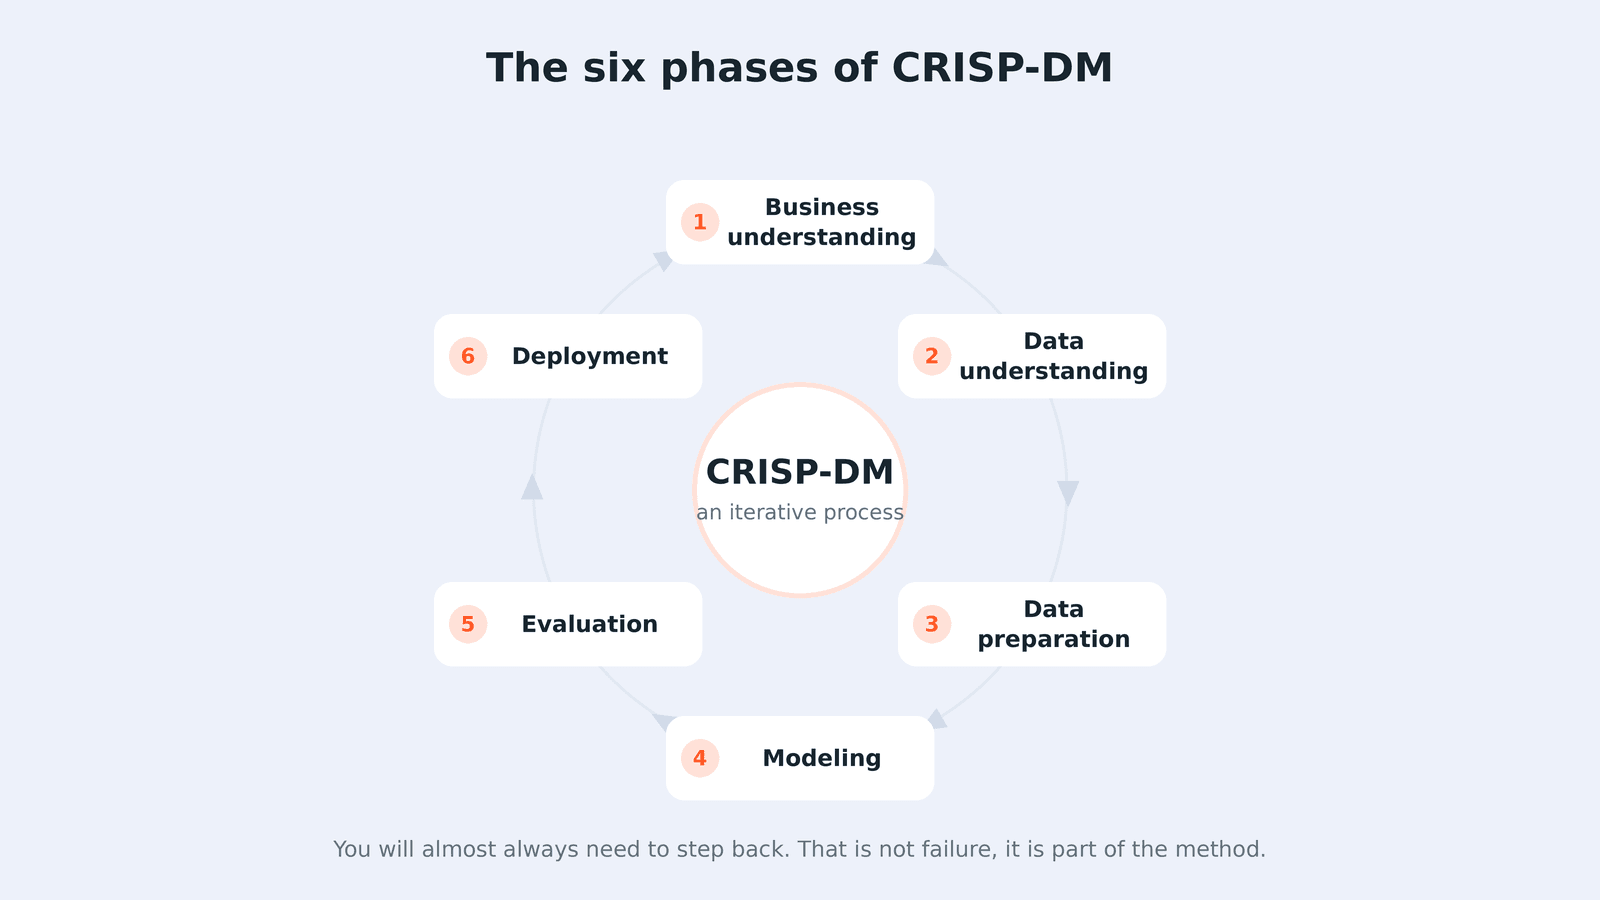
CRISP-DM (Cross Industry Standard Process for Data Mining) is an industry-independent process model for data analysis projects that breaks the work into six phases, from understanding the business goal to operating the finished solution. The point is not the number of phases, but that it defines success from the business side and gives a common language to the business decision-maker and the analyst.
This article walks through the six phases on a real banking example, and shows where a project usually goes off track. If the question is what kind of project is worth starting, the four types of data science projects covers that.
The article first appeared in 2019; we have updated it since, mainly to reflect the deployment phase and the question of new projects based on language models.
In 1996, three companies, DaimlerChrysler, SPSS, and NCR, started from the idea that too many data analysis projects fail. They collected what characterises successful projects, refined and tested it in practice for two and a half years, and by 1999 this became CRISP-DM 1.0.
The methodology had four goals, and they are still relevant today: make the data analysis project understandable even to someone encountering it for the first time, make the process repeatable, give guidance on what the output of the project is, and give a common language to the business side and the analyst.
The methodology is built on three levels. At the top level are the six phases, below that the general tasks that apply to any project, and at the bottom the concrete tasks tailored to the given project. In practice, it is worth keeping the top two levels in mind; the third one is written by each project itself.
| # | Phase | What it addresses | What is the output | Typical effort |
|---|---|---|---|---|
| 1 | Business understanding | What is the problem, and when do we consider it a success? | Business objective, success criteria, data analysis task | Small but critical |
| 2 | Data understanding | What data is available, and what does it mean from a business perspective? | Data description, data owners, initial anomalies | Moderate |
| 3 | Data preparation | How do we turn the data into a table that can be analyzed? | Analytical data table, new variables | The largest |
| 4 | Modeling | Which algorithm can do what with this data? | Trained models, comparison | Small, 5–10 percent |
| 5 | Evaluation | Are the success criteria for the first phase met? | Business decision: move forward or iterate | Small |
| 6 | Deployment | How is it integrated into day-to-day operations? | Production system, monitoring, responsible parties | Ongoing |
The sequence of phases is not a one-way street. In almost every project, it is necessary to backtrack between phases—typically from evaluation to data preparation—and this is not a failure but part of the methodology.
This phase answers four questions. What is the business problem? What is the business goal we want to achieve? How do we measure success quantitatively? And how can all of this be translated into a data analysis task?
The tasks: reviewing business objectives, assessing the situation (resources, constraints, conditions), translating the business objective into technical terms, and defining success criteria.
The banking example. A commercial bank wants to offer credit cards to its existing debit card customers. The idea is to analyze debit card transactions to identify those who are most likely to accept the offer. The bank has already run a similar campaign, so it knows who ultimately adopted the product. The goal: to reach half of the customer base by targeting 10,000 customers—specifically, the most promising candidates. Translated into a data analysis task, this is a classification problem that ranks customers according to their probability of acceptance.
The statement “reaching half of the customer base by targeting 10,000 customers” is worth more than any technical specification. Without it, it will be impossible to determine at the end of the project whether it was successful. This is also the point where data-driven decision-making is put to the test in practice: if the criteria for success aren’t defined in advance, there will always be an explanation after the fact.
This is where we find out what data is available and, more importantly, what it means from a business perspective.
Tasks: collecting available data, identifying data owners (they know what each field actually means), planning how to link data sources, and identifying time frames and common keys. The output of this phase is a detailed data description.
The banking example. There are two datasets: credit card transactions and the results of the previous campaign. The questions are: How can the two be linked? What variables are involved, and what do they mean from a business perspective? Are there any missing values or anomalies? And are there any outliers, such as abnormally high earnings or credit card usage?
If this phase consistently gets stuck at an organization, it’s usually not a project issue but an organizational one: we don’t know what data assets the organization has. That’s what the data asset assessment is for.
This is the longest and least spectacular phase, and the fate of the project is typically decided here. Its purpose is to make the business logic—which the algorithm cannot see on its own—accessible to the algorithm.
The banking example. Transaction data contains many rows per customer, but the model requires only one row per customer. Aggregation is required: average monthly spending, how many days the customer’s paycheck lasts, and the ratio of expenses to income. And there’s one rule that’s easy to get wrong: these aggregates should only be calculated from transactions up to the date of the campaign query, because even in production, the “future” data isn’t available. If this step is overlooked, the model will perform excellently in testing but not in production.
How much time does this actually take? In our experience, roughly 80 percent of a data project’s success depends on this phase. Industry surveys paint a similar picture regarding the time spent: according to the [CrowdFlower's 2016 Data Science Survey](https://www.forbes.com/sites/gilpress/2016/03/23/ data-preparation-most-time-consuming-least-enjoyable-data-science-task-survey-says/) shows that data analysts spend 60 percent of their time on data cleaning and organization, and another 19 percent on collecting data sets. It should be noted that this figure has since been contested by several people, and the exact ratio obviously varies by company and project. However, the trend is the same across all measurements: most of the time is not spent on modeling.
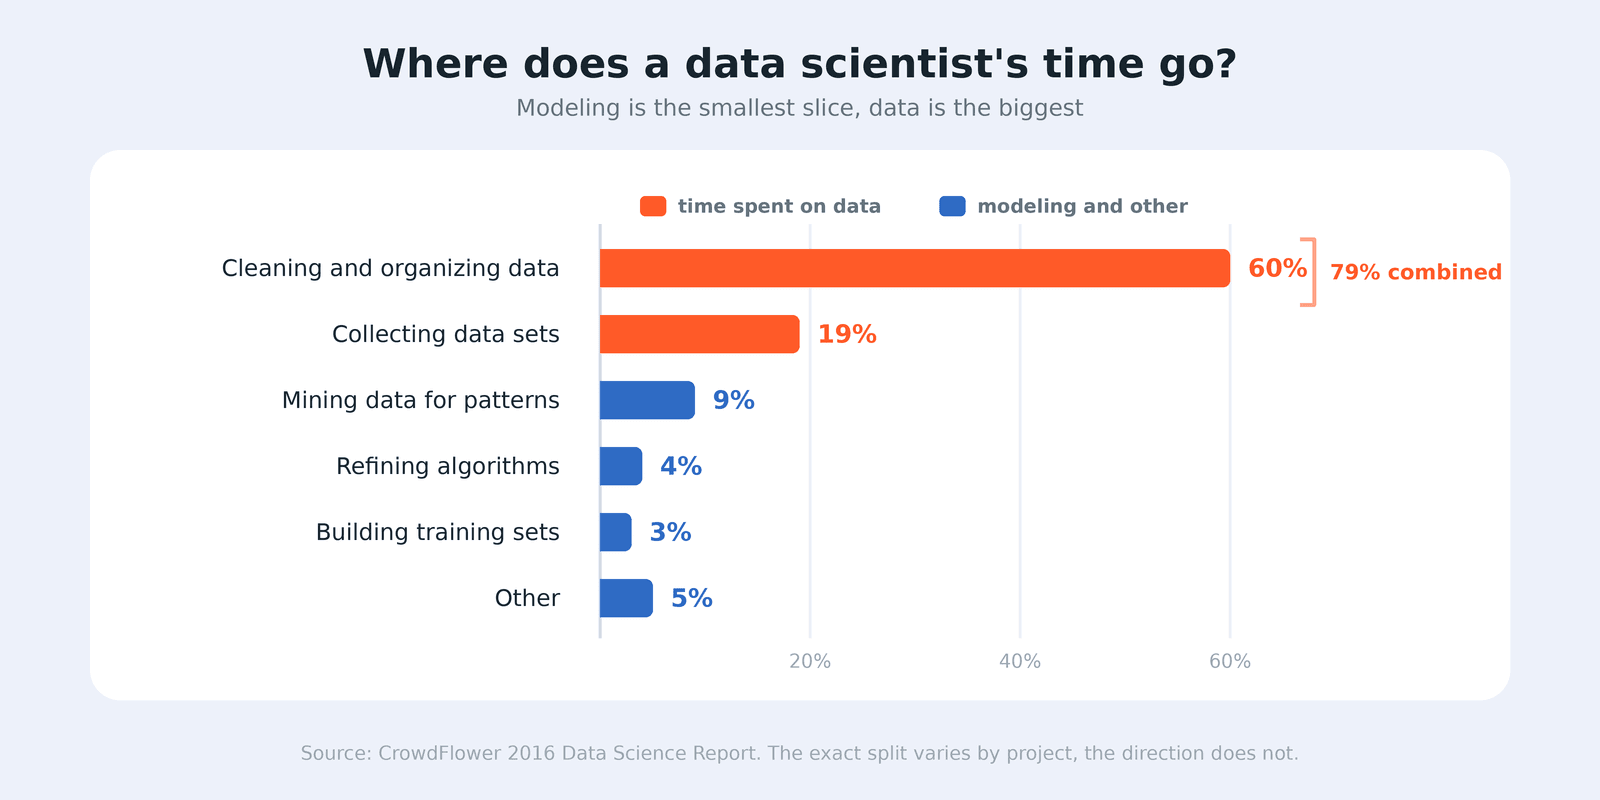
Typically 5-10 percent of the project resources go to this phase, precisely because preparation takes up the bulk of the work.
Tasks: selecting algorithms based on the task recorded in the first phase, creating the test plan (how to measure the model back on historical data), building the models and tuning the parameters, evaluating, and interpreting the relationships found.
Three principles matter a lot. Do not measure the model against randomness, but against a baseline solution. Build models with multiple algorithms and compare them. And use the lessons from the first rounds to create new variables, because most improvement comes not from switching algorithms but from the data.
The banking example. The baseline is the rule the business team has been using manually so far. If the model does not beat that, there is nothing to talk about. If it does, then comes the comparison of multiple algorithms, and in some cases combining them.
This phase is not about model accuracy, but about whether the business success criterion recorded in the first phase is met. Its tasks are: evaluating the model's performance against the business goal, deciding whether it is usable for the business, and, if necessary, stepping back to an earlier phase.
The banking example. If the model predicts acceptance well only two months ahead, while the business had expected a six-month forecast, that is not necessarily a failure: there may still be a useful campaign on a two-month horizon. But the expectation has to be stated again, not brushed aside.
The most common mistake here is not that the model is bad, but that it seems better than it is. The typical model evaluation mistakes are almost all discovered in this phase, or they remain unnoticed right here.
A model is only worth something if it becomes part of operations. Tasks: deployment plan, identifying the affected processes, changing the tasks of the people involved, and planning monitoring and maintenance.
Measuring in production. In the banking example, an A/B test gives the clean measurement: group A consists of the customers selected by the model, group B is the random control. The model is proven if credit card usage is significantly higher in group A. Without this, you cannot separate the effect of the model from the possibility that the campaign would have worked on its own.
Every model has an expiry date. This is the most important sentence in this phase. The market changes, customer behaviour changes, and the structure of the data changes too. That is why monitoring is needed: to watch shifts in the distribution of input data, deterioration in model performance, and to decide in advance at what level of deterioration we retrain it.
Today this part is usually called MLOps: versioned models and data, automated retraining and deployment, alerts. The name is new; the task is not. What the methodology originally did not provide guidance for is explainability: if the model's decision has to be justified to the customer or to the regulator, that comes from the toolkit of explainable artificial intelligence, and it has to be designed already in the fourth phase.
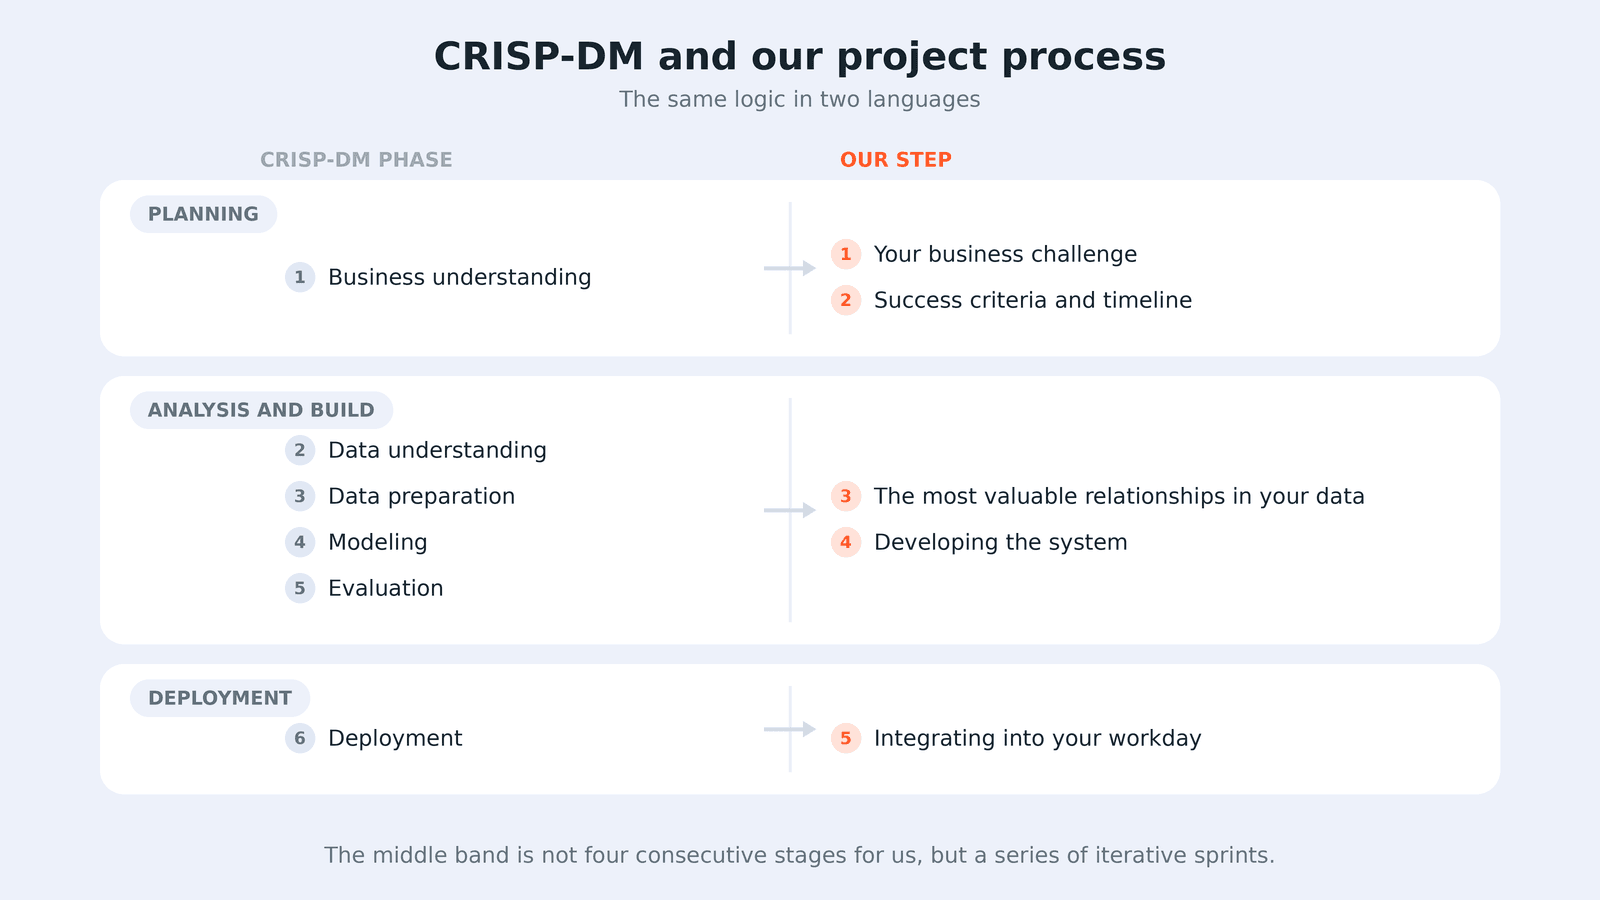
Our own project process has five steps, and these can be mapped to the six CRISP-DM phases.
| Stage | CRISP-DM phase | Our step |
|---|---|---|
| Planning | 1. Understanding business goals | We discuss your business need. We attach scheduling and success criteria to it, tied to objective KPIs |
| Analysis and development | 2-5. Understanding data, preparation, modelling, evaluation | We look for the key relationships in iterative analysis sprints. We develop the system, with a prototype and testing |
| Deployment | 6. Deployment and operation | We fit it seamlessly into your workday, with deployment and maintenance |
The most important point is the second row. For us, the four CRISP-DM phases are not four consecutive stages, but a series of iterative sprints, where each meeting reveals something new. That is what fits the methodology into agile working.
CRISP-DM is not a waterfall model, even if its usual diagram may make it look like one. You almost always need to iterate between phases, and that iteration behaves exactly like a sprint: there is a question, a timebox, and at the end something you can show.
The practical difference compared with a software development sprint is that the output of a data sprint is not always a feature. Sometimes the output is that one direction is not viable, and that is just as valuable if you find out quickly. That is why it is worth planning the early sprints for the greatest uncertainty, not for the easiest task.
Yes, the structure of the six phases stays the same, but the content of two phases is different.
In the third phase, data preparation is partly replaced by context preparation: what documents the system works from, how they are split up, what gets into retrieval. This is just as much the biggest task of the project as assembling the data table is in the classic case.
In the fourth phase, we less often train our own model and more often fit an existing one to the task. In exchange, the fifth phase becomes harder: there is no single accuracy number, and you have to build a test set and evaluation criteria of your own.
What does not change is the first phase. A project based on a language model also goes off the rails if nobody says what success means.
What does the CRISP-DM abbreviation mean? Cross Industry Standard Process for Data Mining. Development started in 1996, and the first version was ready in 1999.
Which phase takes the most time? Data preparation. According to industry surveys, roughly two thirds of a data analyst's time is spent cleaning and organising, while model building typically gets 5-10 percent of project resources.
Is CRISP-DM a waterfall model? No. The order of phases is fixed, but stepping back is part of the methodology, and in practice almost every project needs it. It works well with iterative sprints.
What is the difference between CRISP-DM and TDSP or SEMMA? They all solve the same problem, but with different emphasis. CRISP-DM is the most widely used because it is vendor-independent and starts from the business side, not from the data mining tool.
Can it be used for smaller, few-week projects too? Yes, in fact the first phase is the most important there. In a short project, there is no time to figure out along the way what success means.
If you have a data idea that you are not sure how to turn into a project, the first step is usually not the technology, but saying out loud what would make it successful.
Explainable AI is not a model type, but a toolkit for finding out what a model is based on. An overview of ante-hoc and post-hoc methods, LIME and SHAP, and what regulations expect from explanations.

Data projects do not fail because of technology, but because of human and organisational reasons. The seven most common pitfalls, the seventh success criterion you rarely hear about, and the three steps that can reduce the risk to a fraction.

Every year, roughly 80,000 young people finish without a secondary-school qualification. In a joint project, using DPMK’s domain knowledge, Microsoft’s technology and Dmlab’s data analysis, we looked at three levels at what data can add: what happened, why it happened, and what will happen.

Data driven fuel and transit time planning in road freight

A complex data collection, portfolio management and trading system in the energy sector